/prometheus endpoint. You can also configure Grafana for
real-time visualization and analysis thus allowing for in-depth visibility into
the behavior, performance and health of your instances.
Prometheus integration is only available to users of Dedicated Instance
types and not Free or Shared Instance.
Enable Prometheus for your instance
To enable Prometheus with your Dgraph Cloud instance:- Login to Dgraph Cloud Dashboard, select Settings under the Admin subsection and then select Modify Backend. Alternately, you can also enable Prometheus while launching a new backend.
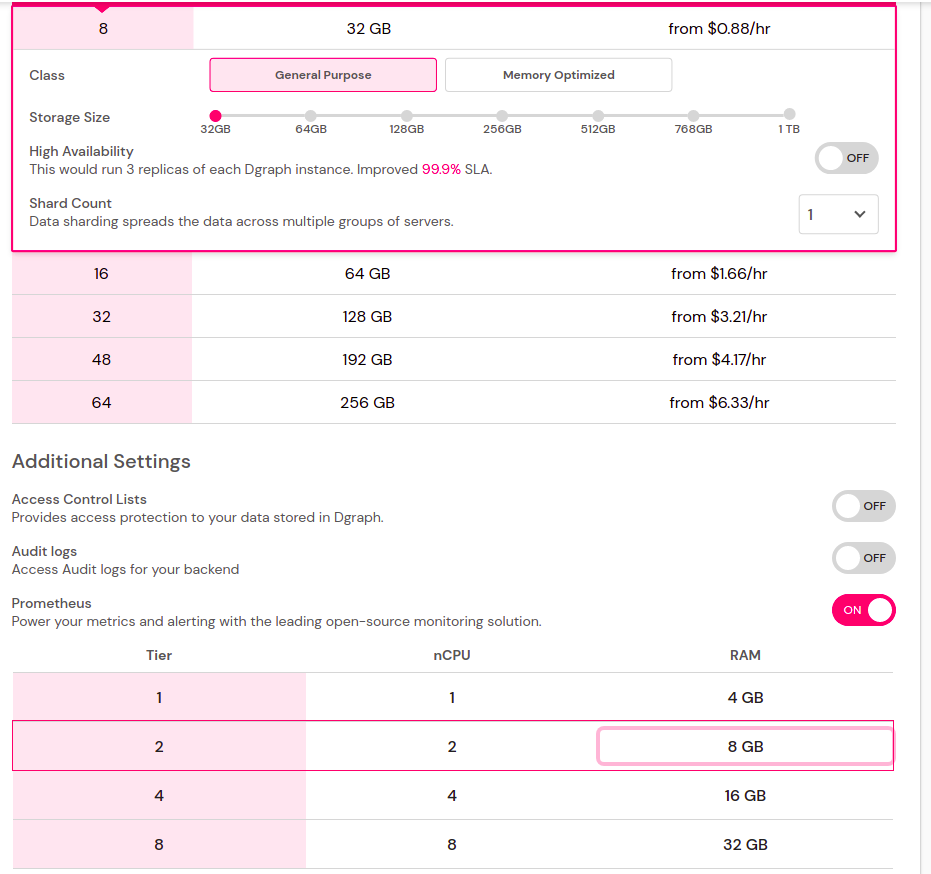
- For your existing Dgraph Cloud Backend, enable the Prometheus option under Additional Settings. Review and select one of the available configurations viz. 1C (1 vCPU 4 GB RAM), 2C, 4C, or 8C.
- Review the estimated hourly cost which should include additional charges for enabling Prometheus. Click Launch to submit changes.

Configure your instance endpoint with Prometheus
-
For all dedicated backends with Prometheus enabled, a new endpoint called
/prometheuswould be available. For example, a backend at URL https://sudomain.region.cloud-provider.cloud.dgraph.io/graphql would expose metrics at URL - https://sudomain.region.cloud-provider.cloud.dgraph.io/prometheus -
The
/prometheusendpoint is protected with the Admin API key. Upon accessing the URL for this endpoint, you are prompted to enter the key. More information on creating an Admin API key can be found here.
-
Once you enter the Admin API token click Submit to launch the
Prometheus Dashboard.

Integrating with Grafana
To visualize Prometheus metrics within the Grafana Dashboard for Dgraph Cloud, perform the following actions:- Launch the Grafana Dashboard and follow the same steps to add a Prometheus Data Source to Grafana as described here but with the following changes:
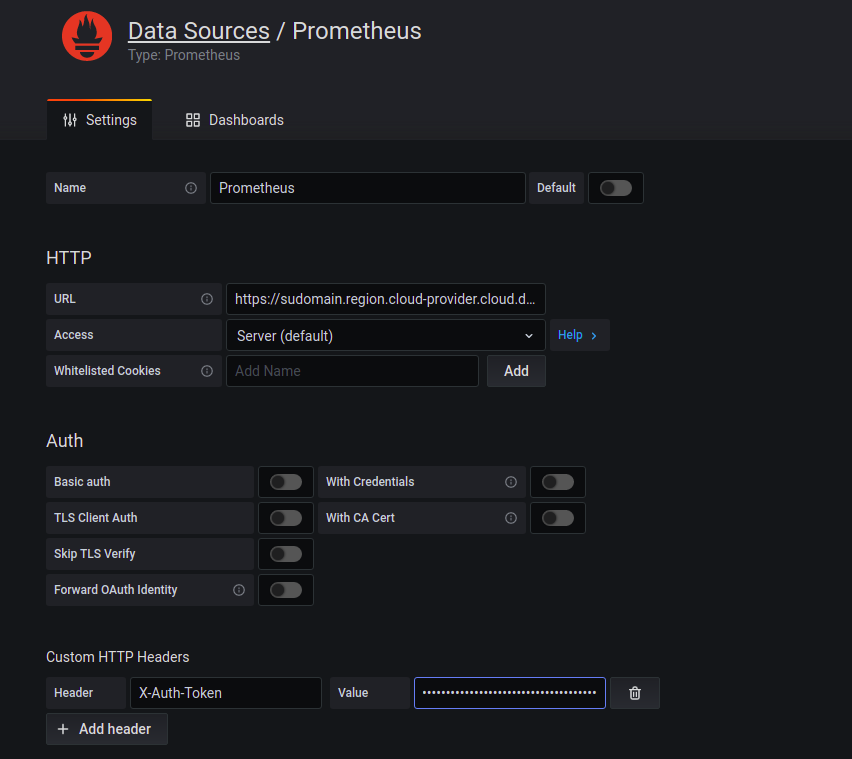
- Under the section HTTP, for the option URL, enter the URL for your Prometheus endpoint (Example - https://sudomain.region.cloud-provider.cloud.dgraph.io/prometheus). For the Access option select Server (default) from the dropdown menu.
-
Lastly, under Auth, within the Custom HTTP Headers subsection, click
Add Header and add a new Header called
X-Auth-Token. Enter your Admin API key as its Value. The following image shows an example data source configuration.
- Click Save & Test to save and test the new Prometheus data source.
-
Create and populate your Grafana Dashboard. Select the Prometheus Data
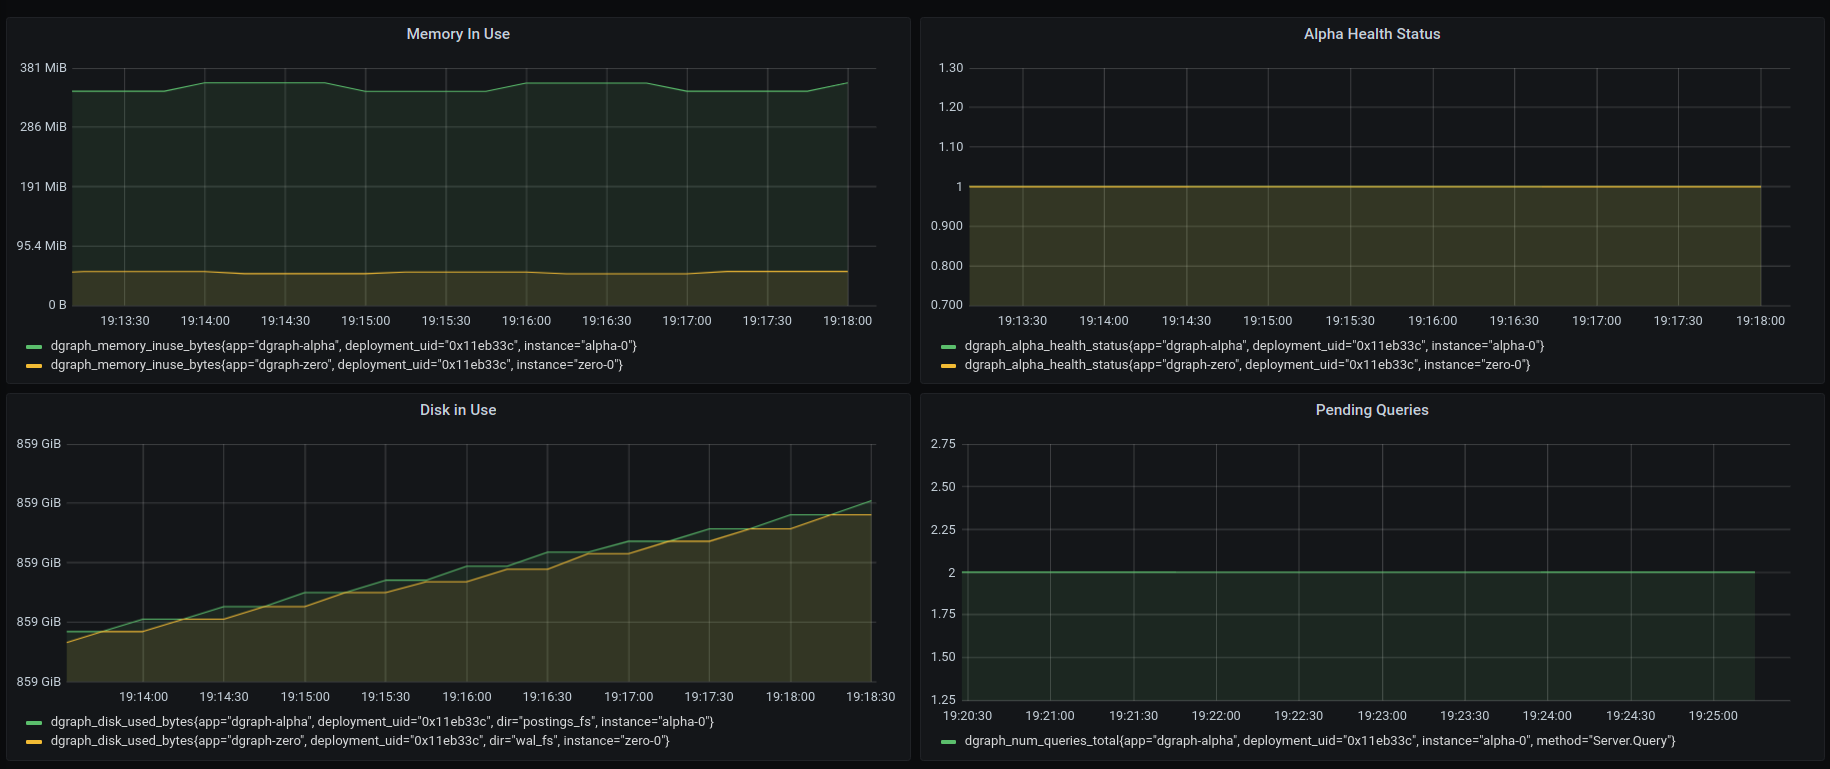
Source that was configured earlier and select the metrics to visualize (for
example
dgraph_memory_inuse_bytesordgraph_alpha_health_status). If correctly configured the metrics can be visualized as below:
